Monthly measles and rubella monitoring report - March 2020
Monthly measles and rubella monitoring report - March 2020
English (1.46 MB - PDF)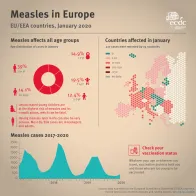
Infographic showing the age distribution of measles cases and the countries affected in January and the number of measles cases 2017-2020.
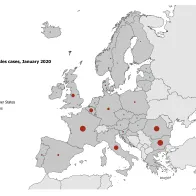
Number of measles cases by country, EU/EEA, January 2020 (n=417)
Number of measles cases by month and notification rate per million population by country, EU/EEA, 1 February 2019–31 January 2020
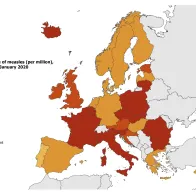
Measles notification rate per million population by country, EU/EEA, 1 February 2019–31 January 2020
Measles notification rate per million population by country, EU/EEA, 1 February 2019–31 January 2020

Number of measles deaths by country, EU/EEA, 1 February 2019–31 January 2020 (n=10)
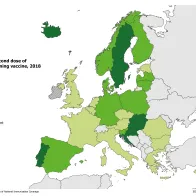
Vaccination coverage for second dose of a measles-containing vaccine, EU/EEA, 2018

Number of rubella cases by country, EU/EEA, January 2020 (n=43)
Number of rubella cases by month and notification rate per million population by country, EU/EEA, 1 February 2019–31 January 2020
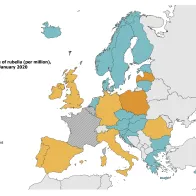
Rubella notification rate per million population by country, EU/EEA, 1 February 2019–31 January 2020
All reports
More on the topic
Share this page

