Key facts
Important: This ERVISS publication follows the recent transition of reporting surveillance data from The European Surveillance System (TESSy) to EpiPulse Cases (EPC). As a result of this transition, we have identified a few data inconsistencies. We are actively working with individual countries to resolve these and any other issue that may arise to ensure high data quality. During this period, data updates to the GitHub repository will be paused. Thank you for your patience and understanding.
Summary
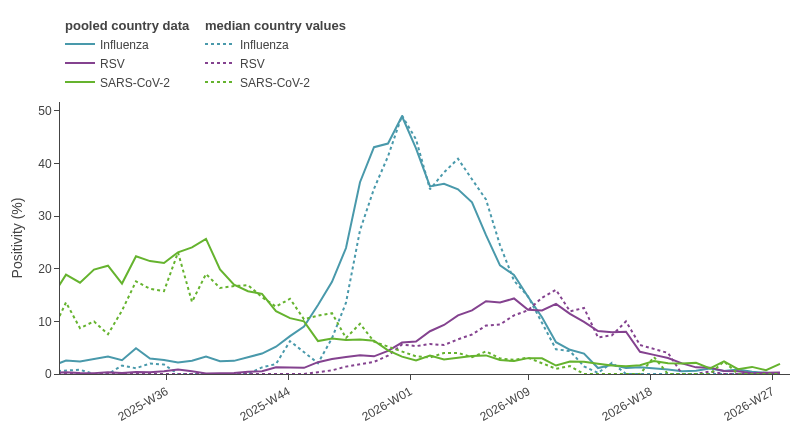
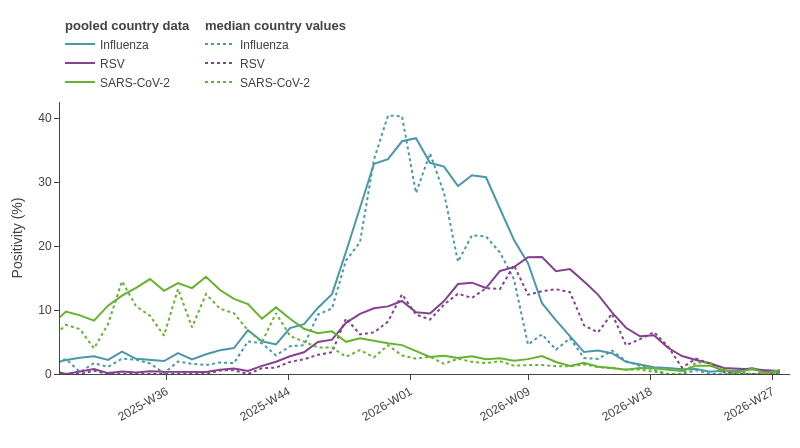
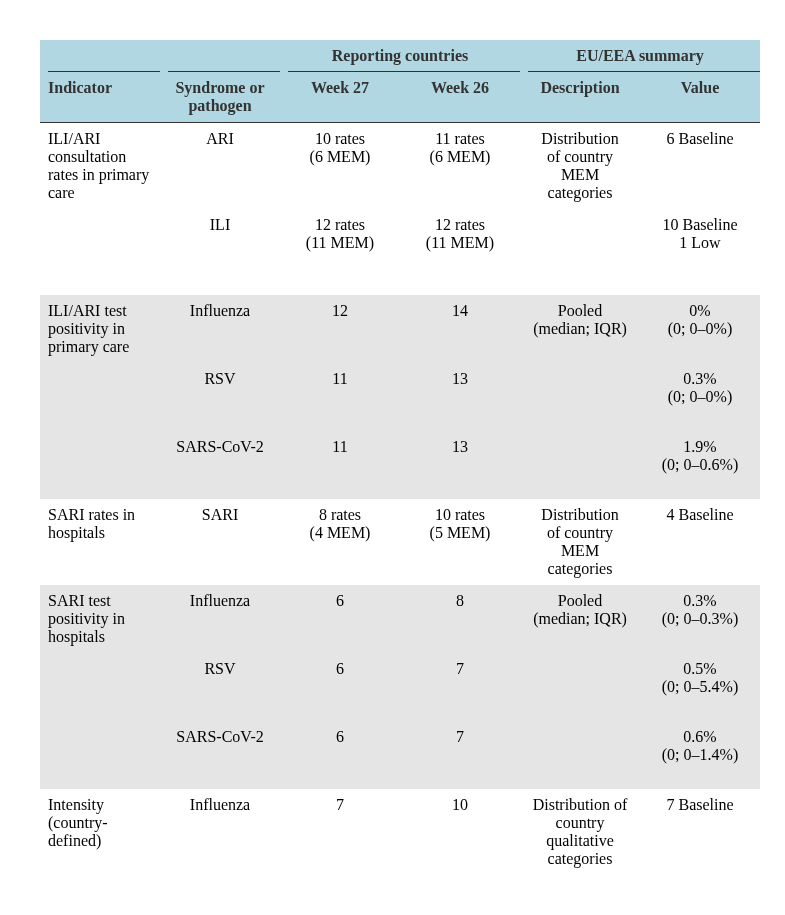
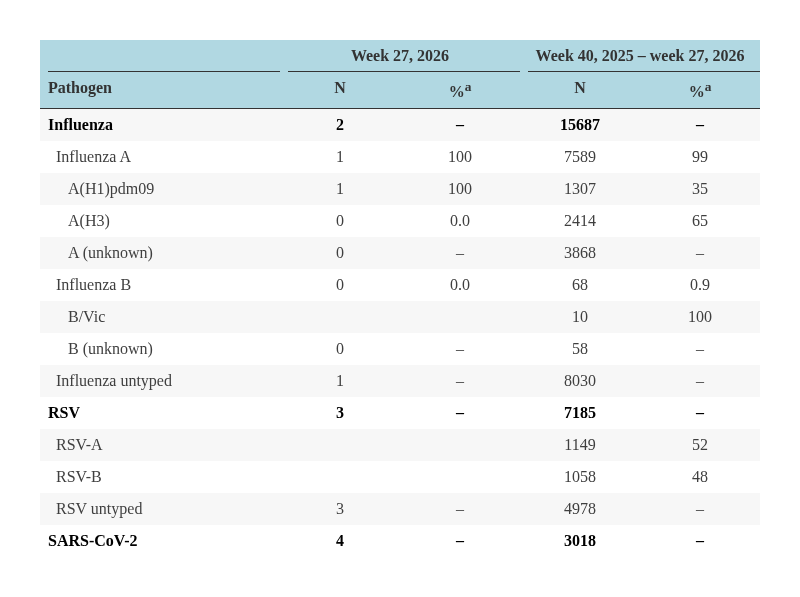
Respiratory virus activity across EU/EEA countries remains at baseline levels, indicating limited respiratory virus circulation.
SARS-CoV-2 activity is low in all age groups in primary and secondary care.
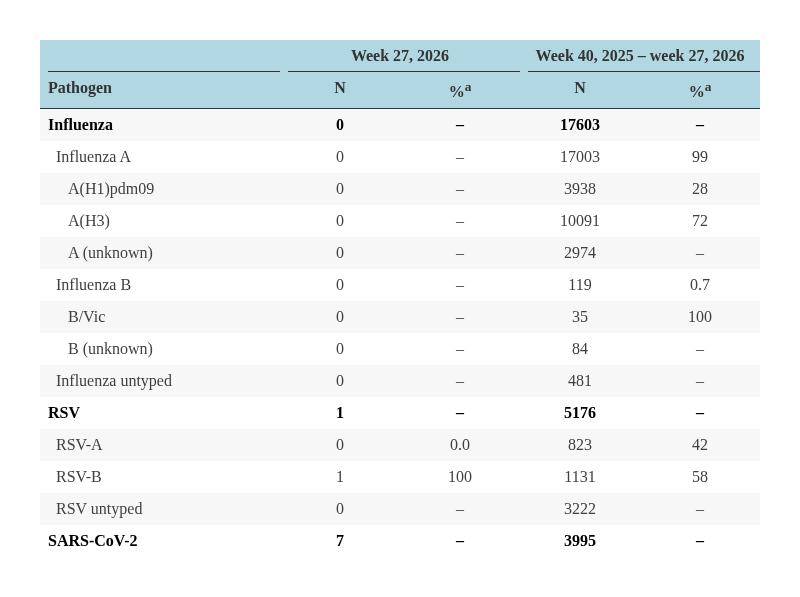
Respiratory syncytial virus (RSV) activity is low, at inter-seasonal levels.
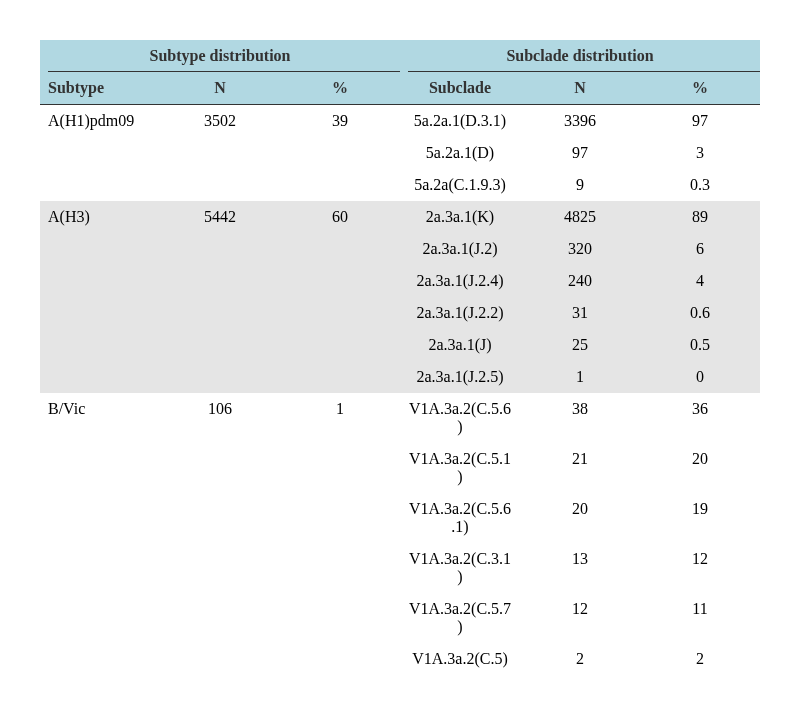
Influenza virus activity is low, at inter-seasonal levels.
This week’s EuroMOMO pooled estimates of all-cause mortality for the participating 27 European countries show increased mortality around week 26, 2026. This increase is mainly seen in age groups above 45 years and is affecting some countries.
All data are provisional and may be affected by reporting delays, incomplete country data or low testing volumes. A few countries with high testing rates can disproportionately influence pooled data. Further information is available under ‘Country notes’ and ‘Additional resources’.
Overview
ECDC monitors respiratory illness rates and virus activity across the EU/EEA. Findings are presented in the European Respiratory Virus Surveillance Summary (ERVISS.org), which is updated weekly.
Key visualisation from the weekly bulletin are included below.