Periodic monitoring
Active
Key facts
- Consultation rates for respiratory illness in both primary and secondary care are slowly increasing, but remain at low or baseline levels in all reporting EU/EEA countries.
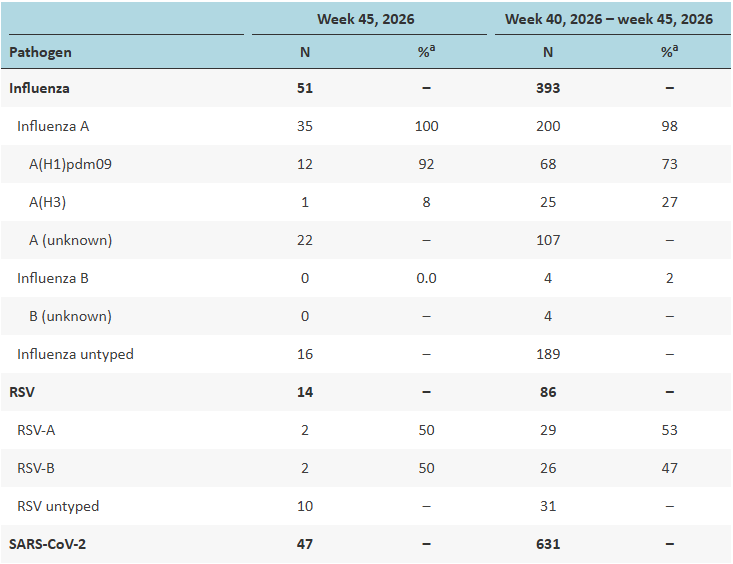
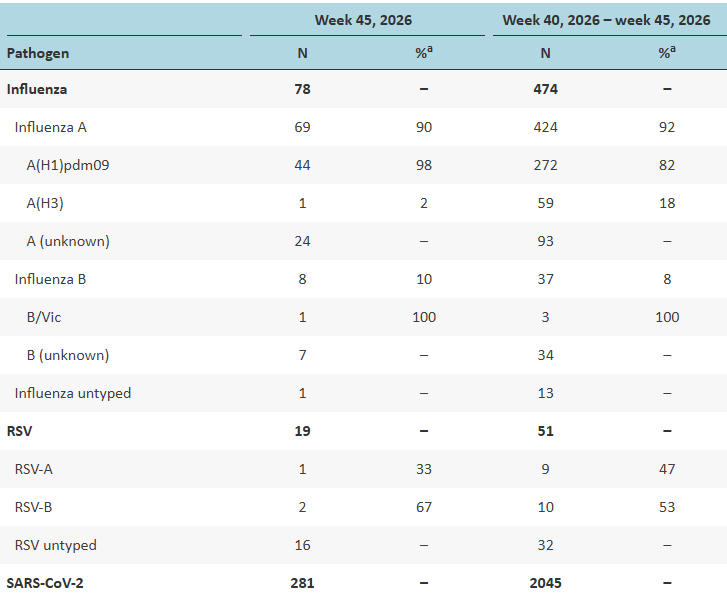
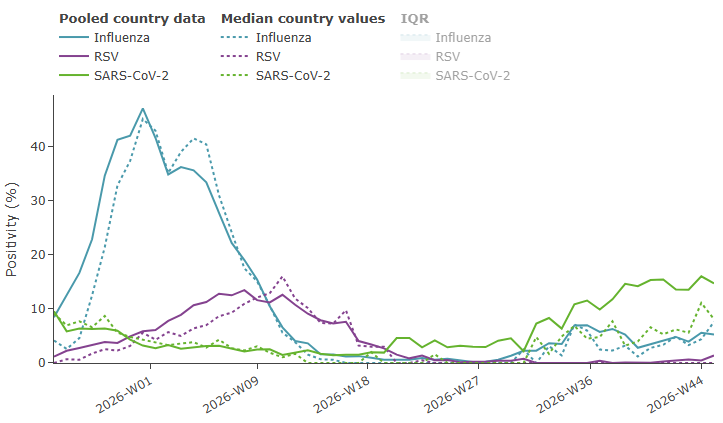
- SARS-CoV-2 remains the main contributor to respiratory virus activity this week, with a median test positivity of 11% in both primary and secondary care, followed by influenza, with a median test positivity of around 5% in both primary and secondary care.
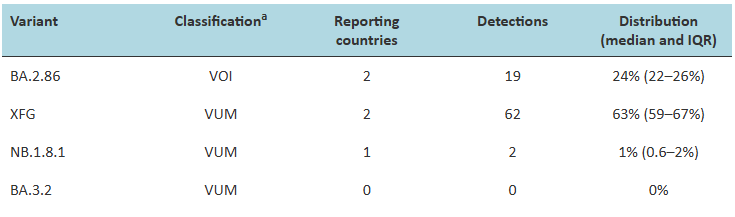
- SARS-CoV-2 test positivity continues to increase in many countries, while others have clearly passed their peaks, with no clear geographical pattern across the EU/EEA. The current epidemic wave has resulted in fewer hospitalisations than in previous years, three-quarters of which have been among adults 65 years old and above. Very few SARS-CoV-2-related deaths have been reported and EuroMOMO's all-cause mortality monitoring shows expected levels.
- Influenza virus activity remains relatively low overall throughout the EU/EEA. Since week 37, the numbers of detections reported in both primary and secondary care have been consistently higher than during interepidemic levels. Although the overall curve remains quite flat and the seasonal epidemic has not yet started, several countries show increasing trends from low levels. So far, detected viruses mostly belong to the influenza A virus type, with A(H1N1)pdm09 being the main identified subtype.
- Respiratory syncytial virus (RSV) activity remains very low, with very few detections across all surveillance systems.
Overview
ECDC monitors respiratory illness rates and virus activity across the EU/EEA. Findings are presented in the European Respiratory Virus Surveillance Summary (ERVISS.org), which is updated weekly.
Key visualisations from the weekly bulletin are included below.
All data are provisional and may be affected by reporting delays, incomplete country data or low testing volumes. A few countries with high testing rates can disproportionately influence pooled data. Further information is available under ‘Country notes’ and ‘Additional resources’.